The EVANI survey is unique in capturing the thoughts of existing electric vehicle drivers in Northern Ireland. This results in data that reflects real world experience, rather than assumptions.
Our 2023 survey received 535 responses, providing insights that will be fed into our stakeholder meetings.
Thank you to everyone that took part.
The Headlines
- More than 8 out of 10 (81.2%) of drivers said they were Satisfied or Very Satisfied with their EV’s range
- Last year more than two-thirds (67.8%) said they had to wait Very Often or Always for a charger. This year that has fallen dramatically to 24.9%
- Almost half of respondents (48.4%) believe it is getting Easier to get a public charge in NI – compared to just 1.8% in our 2022 survey
- More than 4 out of 10 drivers (44.5%) attempt to use the public charging network at least once per month
- The top 5 most popular EVs are 1.Tesla Model 3, 2.Nissan Leaf, 3.VW ID.3, 4.Tesla Model Y and 5.BMW i4.
- 81.6% of NI’s EV drivers say they will Likely or Definitely buy another EV next, just 1.7% said Definitely No
- Only 18.0% charge their EV Every Day, with the most common answer being Several Times per Week (58.0%), while approaching one quarter (22.8%) only charge Several times a month.
- More than 9 out of 10 (92.7%) of respondents have access to off-street parking
- 94% have access to a home charger
- Even with record energy costs, 57% said they moved to an EV to reduce costs (Running Costs 36.8% plus Tax benefits 20.2%). Environmental benefit was the second most common single answer with 28.2%.
- For almost 9 out of 10 (87.7%), the EV is the Primary Vehicle (63.6%) or Only Vehicle (24.1%) in the household.
- Purchase cost is now judged as the single biggest barrier to entry for EV ownership, rising from 35.4% last year to 51.6% this year.
- More than one in five (21.9%) bought their EV second hand
- The top 3 most popular location types for public chargers are 1.Forecourt service stations, 2.Public Car Parks and 3.Shopping centres or Retail Parks
- 90.8% would like to see DC Rapid Charging prioritised going forward
- Just 1.6% say they could definitely swap their cars for public transport and / or active travel
Which council area do you live in
Here’s the ranking and number of EV drivers by Council area, from the most popular to least.
- Ards and North Down Borough Council – 96
- Lisburn and Castlereagh City Council – 82
- Belfast City Council – 67
- Antrim and Newtownabbey Borough Council – 64
- Armagh City, Banbridge and Craigavon Borough Council – 45
- Mid and East Antrim Borough Council – 39
- Newry, Mourne and Down District Council – 38
- Causeway Coast and Glens Borough Council – 29
- Fermanagh and Omagh District Council – 25
- Derry City and Strabane District Council – 24
- Mid Ulster District Council – 19
- Other – 7
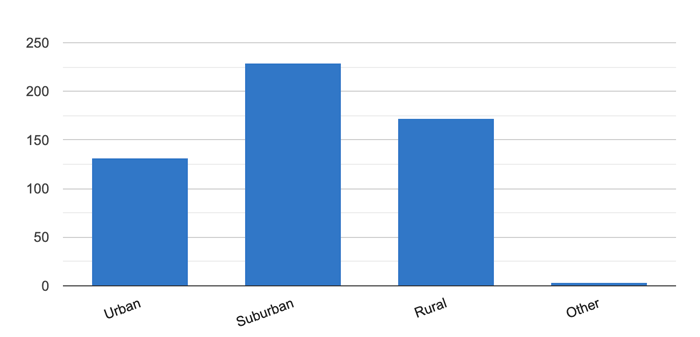
Is your home address…
- Suburban – 42.8%
- Rural – 32.1%
- Urban – 24.5%
- Other – 0.6%
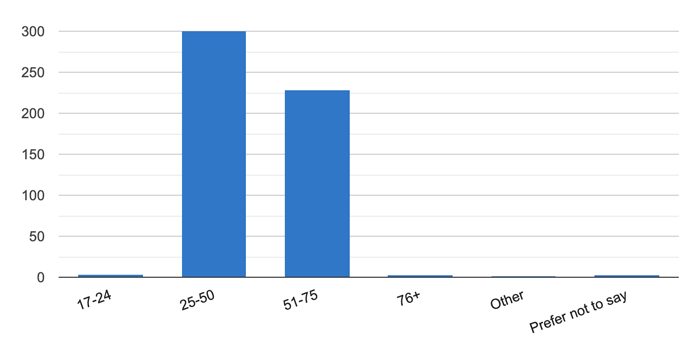
What Age group are you
- 25-50 – 56.0%
- 51-75 – 42.6%
- 17-24 – 0.6%
- 76+ – 0.4%
- Prefer not to say – 0.4%
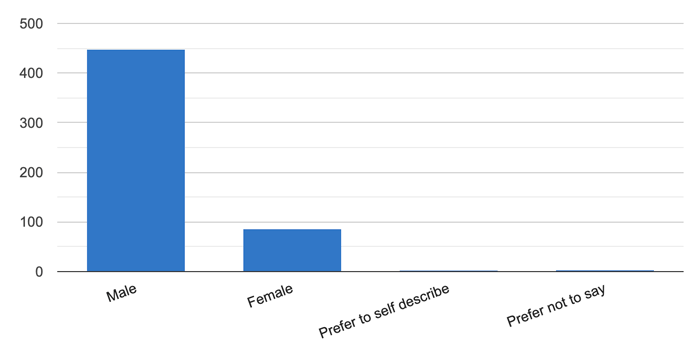
Gender: How do you identify
- Male – 83.6%
- Female – 16.0%
- Prefer not to say – 0.4%
Make
We’ve increased our Top 10’s from last year to Top 20’s this year, a sign of the expanding choice of brands and models available. The majority of drivers obtained their electric vehicles in the past 2 years (60%).
Top 20 EV Brands
- Tesla
- VW
- Nissan
- BMW
- Kia
- Hyundai
- Audi
- MG
- Renault
- Mercedes
- Jaguar
- Peugeot
- Polestar
- Vauxhall
- Ford
- Skoda
- Mini
- Volvo
- Mazda
- Cupra
Top 20 Models
- Tesla Model 3
- Nissan Leaf
- VW ID.3
- Tesla Model Y
- BMW i4
- Audi Etron
- Renault Zoe
- Kia Niro
- Jaguar I-Pace
- MG4
- Hyundai Kona
- VW ID.4
- BMW iX3
- Peugeot e-2008
- Kia EV6
- IONIQ 5
- BMW i3
- Tesla Model S
- Ford Mustang Mach E
- Skoda Enyaq
Top 5 years of purchase
- 2022 – 172 – 32.1%
- 2023 – 149 – 27.9%
- 2021 – 118 – 22.0%
- 2020 – 49 – 9.2%
- 2019 – 20 – 3.7%
- 2018 – 10 – 1.9%
- Older – 17 – 3.2%
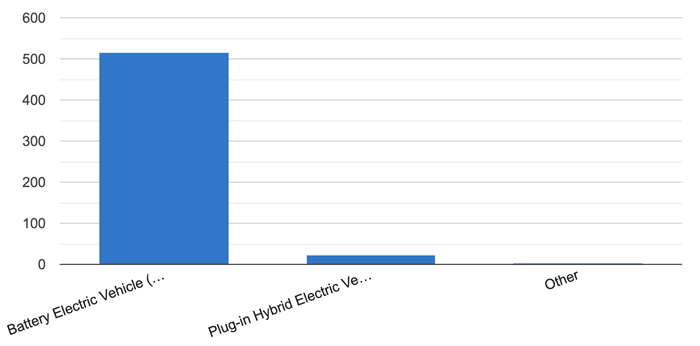
Is your Electric Vehicle considered a…
Our survey was focussed on plug-in Electric Vehicles and not ‘self-charging’ or ‘mild’ hybrids. Of those that responded the vast majority were full Battery Electric Vehicles (96.1%) with replies from Plug-in Hybrid owners falling from 5.7% last year to 3.9% this year.
- Battery Electric Vehicle (BEV) – (inc REX) – 96.1%
- Plug-in Hybrid Electric Vehicle (PHEV) – 3.9%
- Other – 0.0%
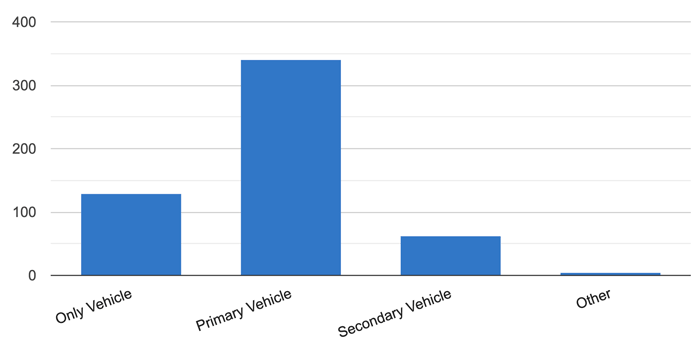
In your Household is this EV your…
In the majority of households (87.7%), the EV is the Primary Vehicle (63.6%) or Only Vehicle (24.1%). 11.6% use their EV as a Secondary Vehicle.
- Primary Vehicle – 63.6%
- Only Vehicle – 24.1%
- Secondary Vehicle 11.6%
- Other – 0.7%
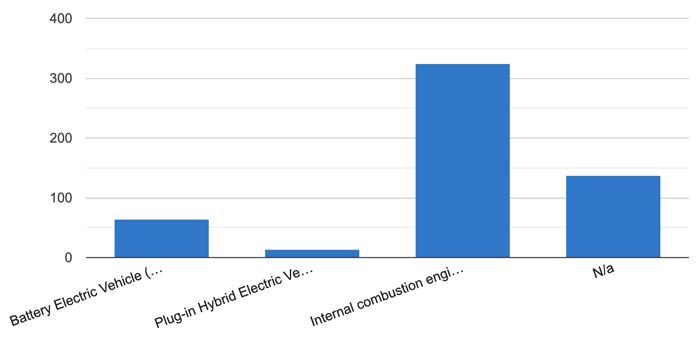
If you have a secondary vehicle, is it…
60.4% of respondents said their secondary vehicle had an Internal combustion engine. 11.8% have a secondary Battery Electric Vehicle while 2.4% have a secondary Plug-in Hybrid.
- Internal combustion engine (ICE) – 60.4%
- Not Applicable – 25.4%
- Battery Electric Vehicle (BEV) – 11.8%
- Plug-in Hybrid Electric Vehicle (PHEV) 2.4%
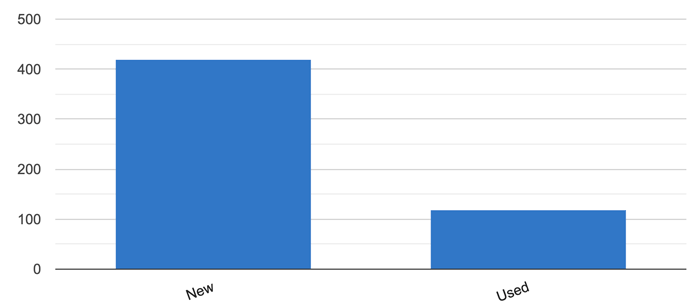
When you bought it, was your current EV…
78.1% bought a new EV while more than 1 in 5 (21.9%) bought theirs 2nd hand, up from 19.4% last year.
- New – 78.1%
- Used – 21.9%
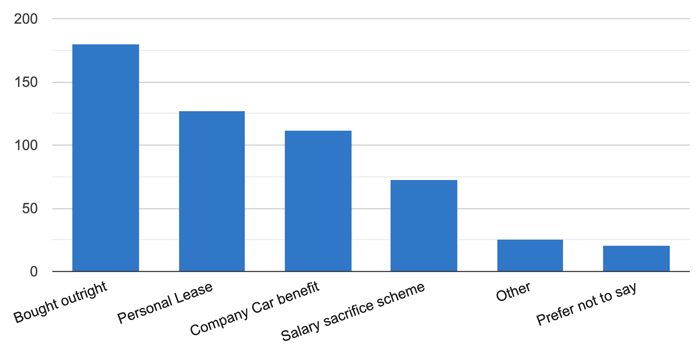
How did you acquire your vehicle?
Around one third (33.6%) of EVs were Bought Outright. A Personal Lease was the 2nd most popular choice with 23.7%. Company Cars and Salary sacrifice schemes make up a combined 34.2%.
- Bought outright – 33.6%
- Personal Lease – 23.7%
- Company Car benefit – 20.7%
- Salary sacrifice scheme 13.5%
- Other – 4.7%
- Prefer not to say – 3.7%
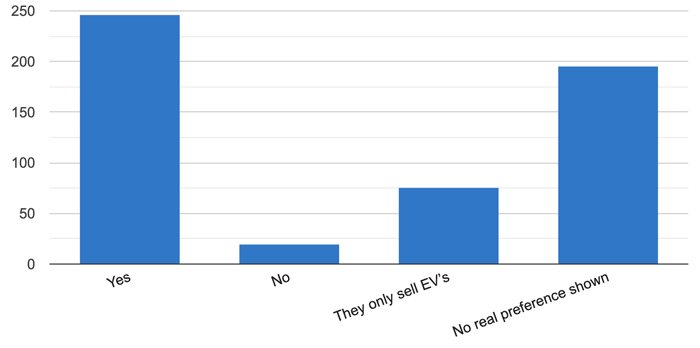
Thinking about the purchase of your EV, were the dealers keen to sell an EV
With very similar results to last year, 46.0% reported dealers are keen to sell EVs. Just 3.6% reported they had found resistance, down from 4.8% last year.
- Yes – 46.0%
- No real preference shown – 36.4%
- They only sell EV’s – 14.0%
- No – 3.6%
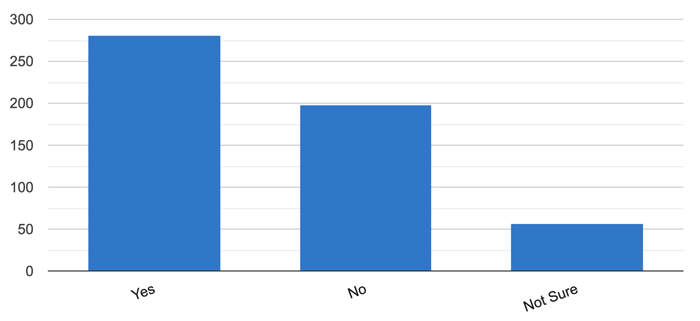
When collecting your vehicle were you provided with enough information about charging
Things continue to move in the right direction, with 52.5% reporting they received enough information on charging from the dealership during the handover (up from 50.8% last year) .
- Yes – 52.5%
- No – 37.0%
- Not Sure – 10.5%
How many years have you owned a plugin EV
The median answer to this question was 2 years (it was 1 year in our last survey) and the average length of ownership was 2.45 years.

How many miles do you drive per year in your EV
The average annual EV mileage is 12,700 miles (median 12,000 miles).

If relevant, How many miles do you drive per year in your Non-EV
Where homes have more than 1 car, the EV takes the majority of the strain with the 2nd vehicle travelling an average of 5,275 miles (median 5,000 miles).

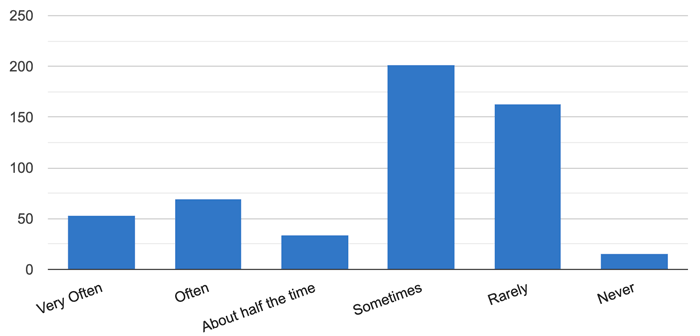
How often do you drive more than 100 miles in one trip?
7 out of 10 (70.8%) said they Sometimes, Rarely or Never drive more than 100 miles in one trip. Very often, Often and About Half the Time made up 29.2%.
- Sometimes – 37.6%
- Rarely – 30.4%
- Often – 12.9%
- Very Often – 9.9%
- About half the time – 6.4%
- Never 2.8%
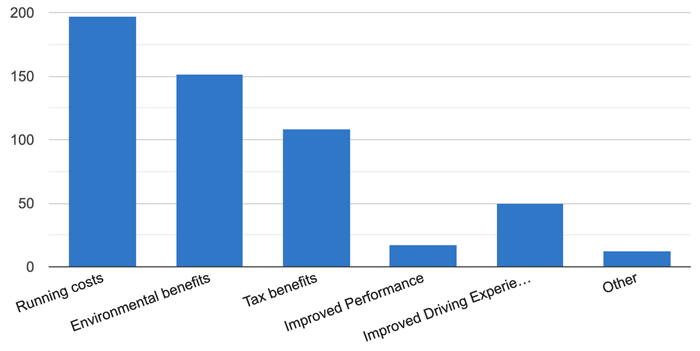
What influenced you most in moving to an EV
With a combined 57%, the top reason to move to an EV remains reduced costs (Running Costs 36.8% plus Tax benefits 20.2%). Environmental benefit was the #2 most common single answer with 28.2%.
- Running costs – 36.8%
- Environmental benefits – 28.2%
- Tax benefits – 20.2%
- Improved Driving Experience – 9.3%
- Improved Performance – 3.2%
- Other – 2.2%
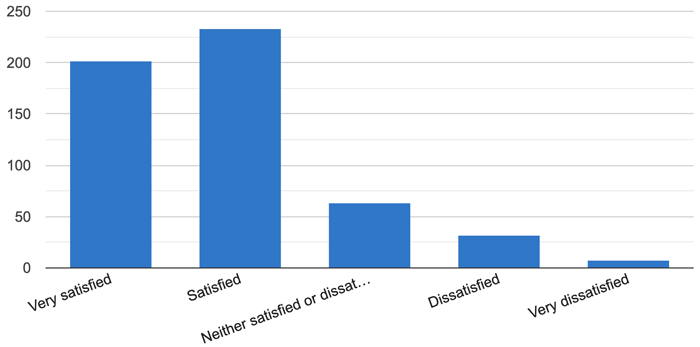
How do you rate the range of your EV for your needs
More than 8 out of 10 (81.2%) of drivers said they were Satisfied or Very Satisfied with their EVs range. 7.0% said they were Dissatisfied or Very Dissatisfied.
- Satisfied – 43.6%
- Very satisfied – 37.6%
- Neither satisfied or dissatisfied – 11.8%
- Dissatisfied – 5.7%
- Very dissatisfied – 1.3%
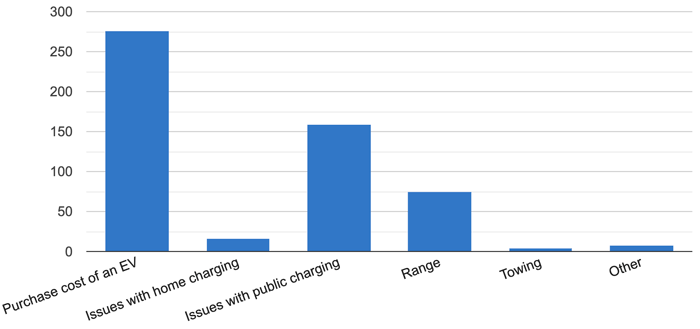
What is the single biggest barrier to entry for EV ownership
This question saw one of the biggest swings in response compared with last year as Issues with public charging moved off the number 1 spot (previously 52.7%) to the number 2 position this time with 29.6%. The combination of new DC chargers and pay-to-charge being turned on has started to improve things . Purchase cost is now judged as the single biggest barrier to entry for EV ownership, rising from 35.4% last year to 51.6% this year.
- Purchase cost of an EV – 51.6%
- Issues with public charging – 29.6%
- Range – 13.8%
- Issues with home charging – 3.0%
- Other – 1.3%
- Towing – 0.7%
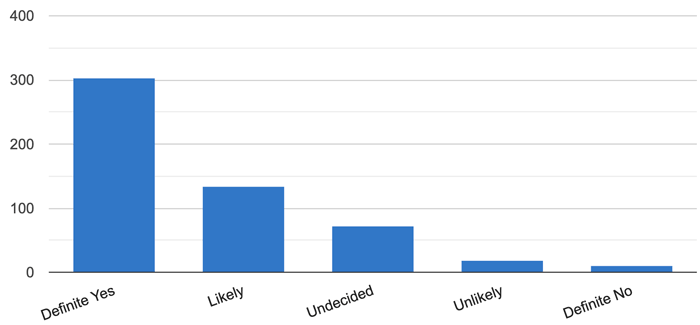
How likely is it that your next car will be a plugin EV
81.6% of NI’s EV drivers say they will Likely or Definitely buy another EV, with 13.3% Undecided, 3.4% say it is Unlikely and just 1.7% said Definitely No.
- Definite Yes – 56.6%
- Likely – 25.0%
- Undecided – 13.3%
- Unlikely – 3.4%
- Definite No – 1.7%
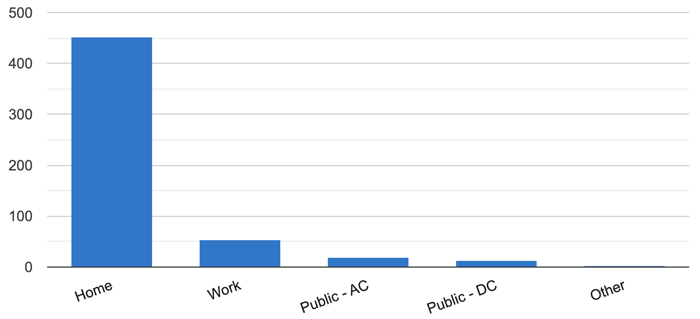
Do you charge mostly at…
Home remains the location where people charge most often, increasing from 71.1% last year to 84.5% this time. Users that carry out most of their charging at public sites have fallen, with mostly at Public AC going from 13.6% last year to 3.4% this time, and mostly at Public DC dropping from 4.0% to 2.2%. This is another swing that is almost certainly a result of pay-to-charge being introduced here. Work is the second most popular location for most charging (9.9%).
- Home – 84.5%
- Work – 9.9%
- Public AC – 3.4%
- Public DC – 2.2%
- Other – 0.0%
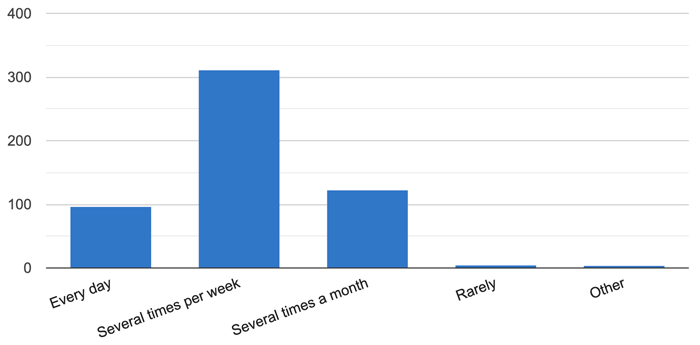
How often do you charge your car?
Only 18.0% charge their EV Every Day, with the most common answer being Several Times per Week (58.0%), while approaching one quarter (22.8%) only charge Several times a month.
- Several times per week – 58.0%
- Several times a month – 22.8%
- Every day – 18.0%
- Other – 0.4%
- Rarely – 0.7%
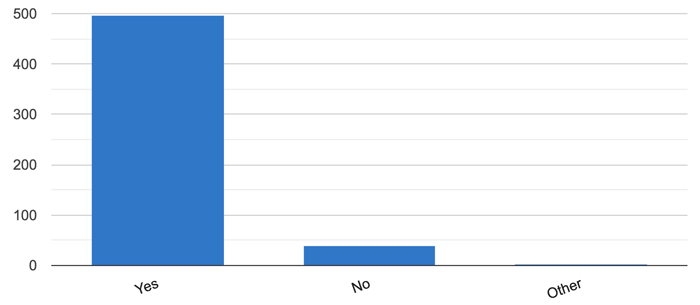
Does your home have off street parking
More than 9 out of 10 (92.7%) of respondents have off-street parking.
- Yes – 92.7%
- No – 7.3%
- Other – 0.0%
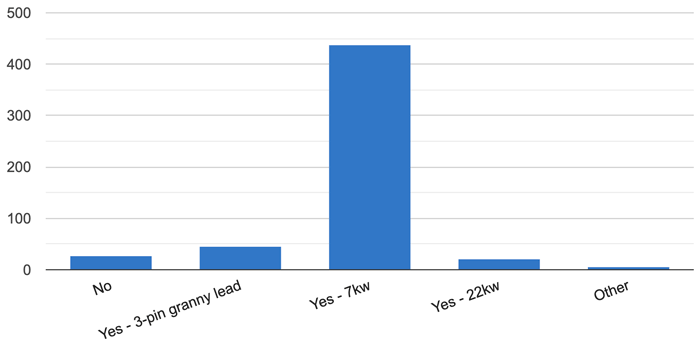
Do you have access to a charge point at home
94% have access to a home charger – 81.9% having a 7 kW unit, 8.2% are still using a 3-pin socket and ICCB (Granny cable) while 3.9% of responders have a 3 phase supply and a 22kW charge point at home.
- Yes 7kW – 81.9%
- Yes 3-pin granny lead – 8.2%
- No – 5.0%
- Yes 22kW – 3.9%
- Other – 1.0%
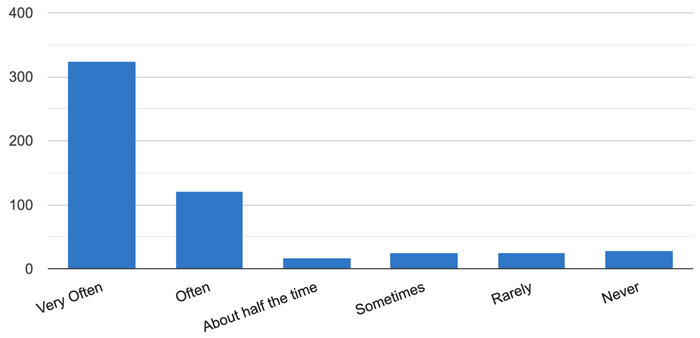
How often do you charge at home?
85.8% of respondents say they charge About half the time, Often or Very often at home, up from 75.3% for the same group last year.
- Very Often – 60.4%
- Often – 22.4%
- Never – 5.0%
- Rarely – 4.7%
- Sometimes – 4.5%
- About half the time – 3.0%
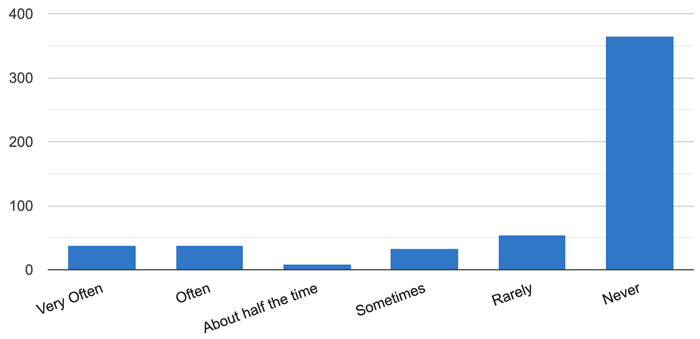
How often do you charge at work?
Workplace charging still remains relatively uncommon with the most popular answer Never accounting for almost 7 out of 10 people (68.3%), up from 65% last year. Just 14.0% say they use it Often or Very Often – down from 15.8% last year.
- Never – 68.3%
- Rarely – 10.0%
- Very Often – 7.1%
- Often – 6.9%
- Sometimes – 6.2%
- About half the time – 1.5%
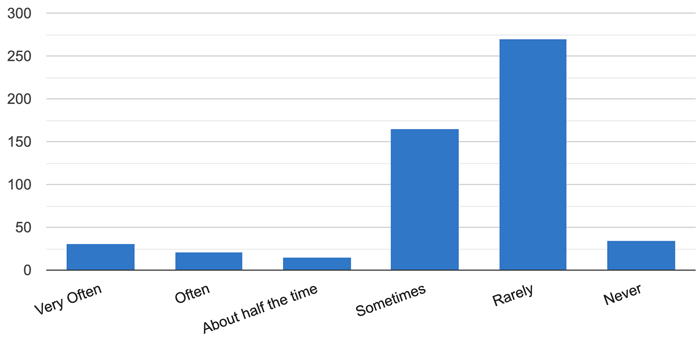
How often do you charge at Public Charging?
This question showed another swing on the previous result. The top answer is now Rarely (50.5%), which was the 2nd most common answer in 2022 with 28.7%. Sometimes has now fallen to the number 2 spot (30.8%) compared to 36.7% last year. Never has increased from 3.0% to 6.4%. Again these changes are most likely attributable to pay-to-charge being introduced.
- Rarely – 50.5%
- Sometimes – 30.8%
- Never – 6.4%
- Very Often – 5.6%
- Often – 3.9%
- About half the time – 2.8%
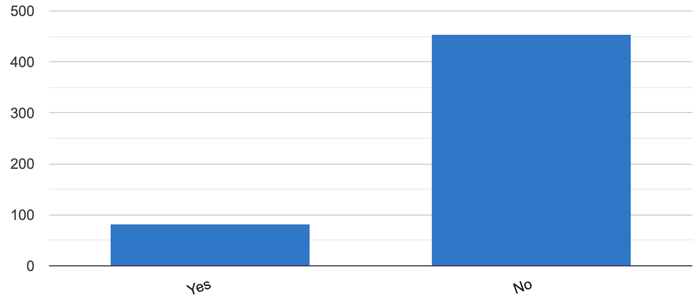
Are you dependent on the public charging network?
84.8% say they are not Dependent on the public charging network here.
- No – 84.8%
- Yes – 15.2%
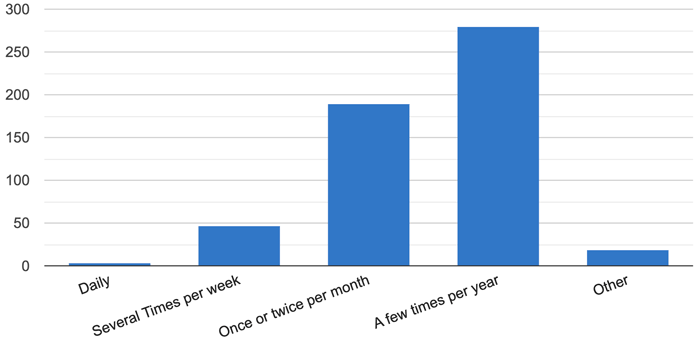
How often do you attempt to charge at a public charge point
More than 4 out of 10 drivers (44.5%) attempt to use the public charging network at least once per month. The ‘A few times per year’ answer is now the most popular, rising from 17.8% in 2022 to 52.1% this time, while ‘Several Times per week’ has dropped from 31.0% to 8.6%. More large swings in behaviour since the introduction of pay-to-charge.
- A few times per year – 52.1%
- Once or twice per month – 35.3%
- Several Times per week – 8.6%
- Other – 3.4%
- Daily – 0.6%
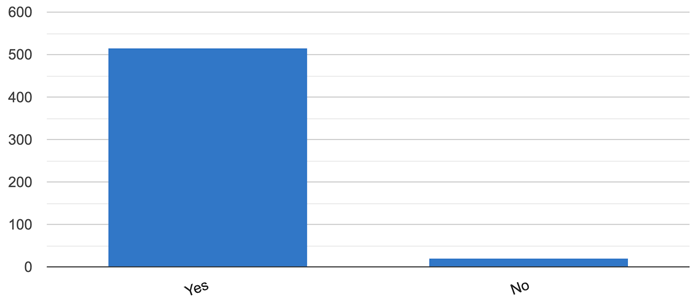
Do you agree that a minimum uptime a service level agreement should ensure charge points are working 99% of the time
Unsurprisingly almost everyone (96.3%) agree with the new ‘Consumer Experience at Public Chargepoints’ legislation to ensure a minimum 99% reliability across public charging infrastructure
- Yes – 96.3%
- No – 3.7%
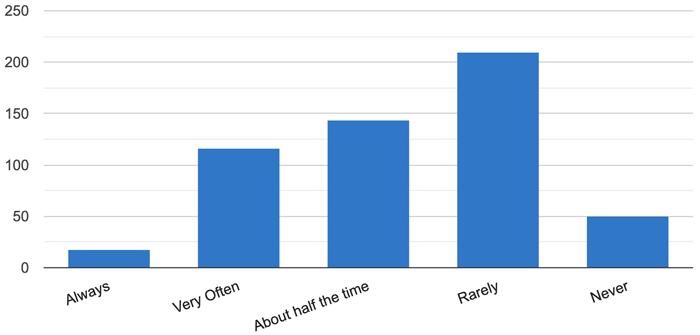
How often do you find you need to wait because the charge point is already in use
Last year more than two-thirds (67.8%) said they had to wait Very Often or Always for a charger. This year that has fallen dramatically to 24.9%, more proof that the new rapid chargers installed over the last 9 months, along with the introduction of pay-to-charge has made tangible improvements for EV drivers here.
- Rarely – 39.1%
- About half the time – 26.7%
- Very Often – 21.7%
- Never – 9.3%
- Always – 3.2%
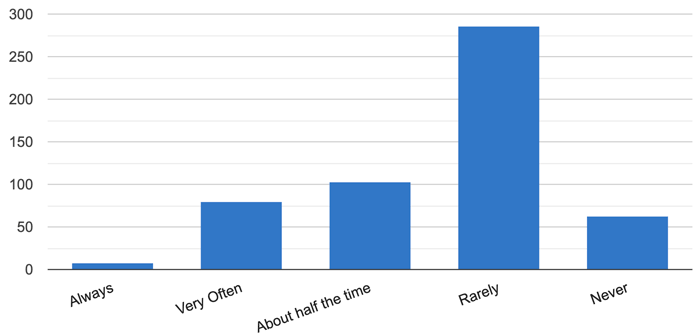
How often do you find public charge points blocked by ICE vehicles or EVs not charging
The most popular answer here is once again Rarely with 53.3% (up from 44.7% in 2022). Very Often or Always has dropped from 24.3% to 16.1%.
- Rarely – 53.3%
- About half the time – 19.0%
- Very Often – 14.8%
- Never – 11.6%
- Always – 1.3%
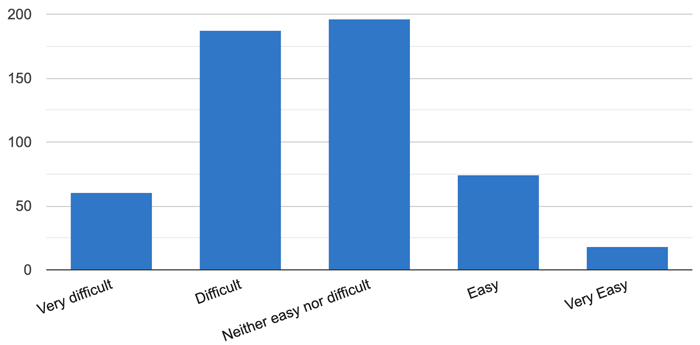
How easy or difficult is it to find a working public charge point when you need one
Around half (46.2%) still say they find it Difficult or Very Difficult to find a working public charger. Overall though this reflects a positive direction of travel as it compares to 76.1% in last year’s survey.
- Neither easy nor difficult – 36.6%
- Difficult – 35.0%
- Easy – 13.8%
- Very difficult – 11.2%
- Very Easy – 3.4%
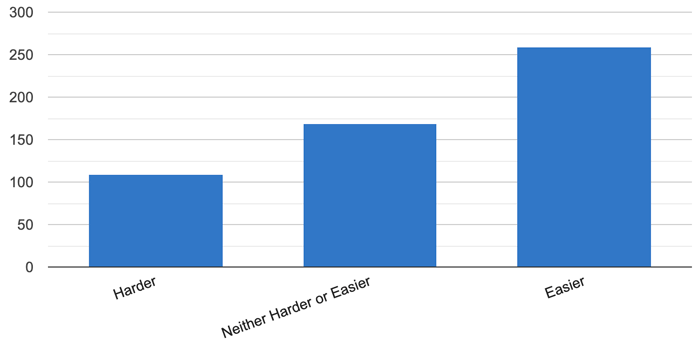
Is it becoming easier or harder to get a public charge?
The most popular answer here, from almost half of respondents (48.4%) shows they believe it is getting easier to get a public charge in NI – compared to just 1.8% in our 2022 survey. 20.2% still believe it is getting harder, although this is down from 79.6% compared to last year.
- Easier – 48.4%
- Neither Harder or Easier – 31.4%
- Harder – 20.2%
Do you have any other issues at public charge points
We had many responses in this free text section. Here are some examples which represent the most common themes.
- Chargers not working
- Leads too short
- Spaces too small
- All different apps required is frustrating. Also constantly seem to be not working
- All should operate with contactless payment and not require own app
- Cable heavy and short at some and no rain cover
- Cable length, having to sign up for an app with no mobile phone signal
- Cables too short, parking bay placement poor in relation to charger
- Charge points not working
- Inaccurate status on app
- Just not enough of them…but getting better
- Lack of facilities at charge points
- Lack of info on how to use eg for new drivers
- Location for lone female not always thought about
- Location often in secluded dark areas
- Main issue was free ESB chargers. Experience has improved a lot since charge introduced
- No weather protection
- Not enough and fast enough models. 50kw is not fast!
- Not enough chademo for nissan, not enough rapid chargers
- Too many different cards, apps, etc. Simple debit card tap should work on all. The Tesla Supercharger network is lightyears ahead
- Too many ESB charge points still broken or off line. This has not changed since pay for charge was introduced.
- The Charge point nearest my home has not worked for over a year.
- The power capacity of the chargers are too low.
- There aren’t enough charge points to give peace of mind
- Tap to pay on every charger would make it much easier
- Screens hard to read. Unclear signage as to which point is which
- Poor layout, poor lighting, lack of amenities or weather protection
- Out of service for lengthy periods
- Not enough rapid 150kWh and above chargers
- Not accepting apple pay
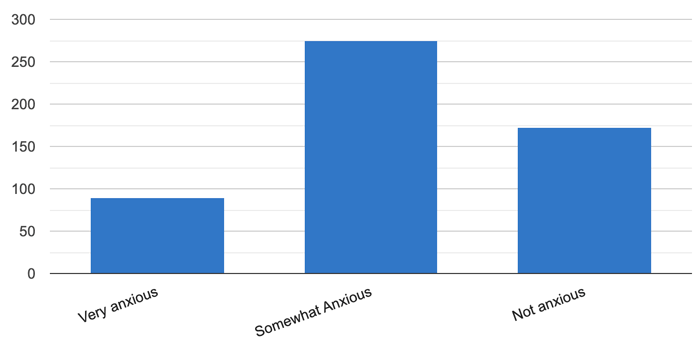
Are you anxious that you’ll be unable to find a working, available public charge point when travelling?
67.9% say they are Somewhat Anxious or Very Anxious about finding a working, available public charge point when travelling, down from 85.6% last year. Very Anxious has halved from last year’s 33.4% to 16.6%, while Not Anxious has doubled from 14.4% to 32.1%
- Somewhat Anxious – 51.2%
- Very anxious – 16.7%
- Not anxious – 32.1%
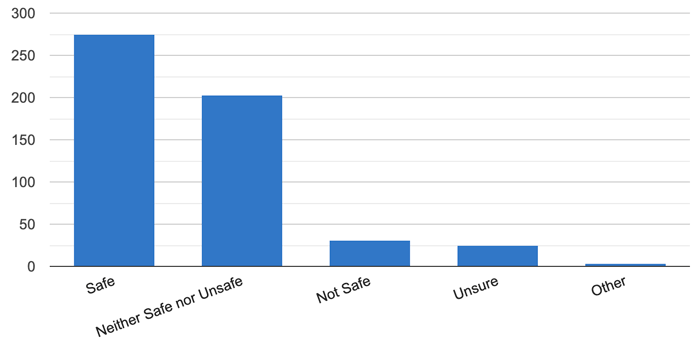
How safe do you feel at public charge points
Just over half of drivers (51.4%) feel Safe at public charge points (up from 47.2% last year). 5.6% do Not Feel Safe (up from 4.3% last year).
- Safe – 51.4%
- Neither Safe nor Unsafe – 37.9%
- Not Safe – 5.6%
- Unsure – 4.5%
- Other – 0.6%
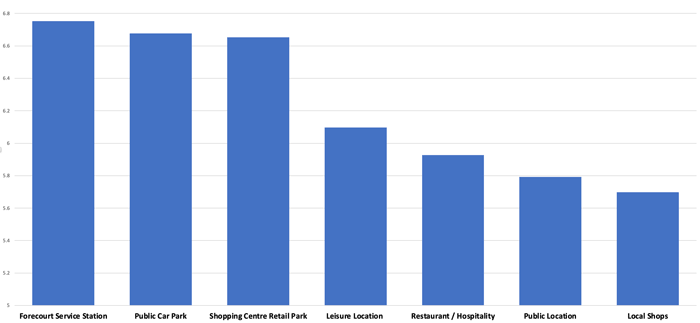
When using public charge points rank in order of importance what type of location you use the most
It will be of interest to Charge Point Operators that your most popular locations for charge points are as follows…
- Forecourt service station
- Public Car Park
- Shopping centre or Retail Park
- Leisure Location – Park, Sportsground, Tourist attraction
- Restaurant/Hospitality location
- Public Location, Station, Hospital, Library etc.
- Local shops
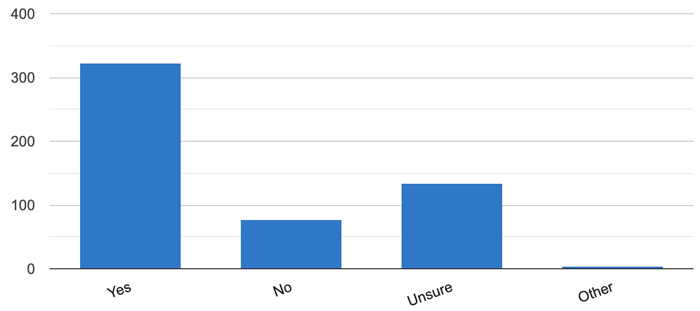
Should Public charge points have rain covers for the units
The majority of drivers (60.2%) want to see some form of rain shelter at public chargers.
- Yes – 60.2%
- Unsure – 24.8%
- No – 14.4%
- Other – 0.6%
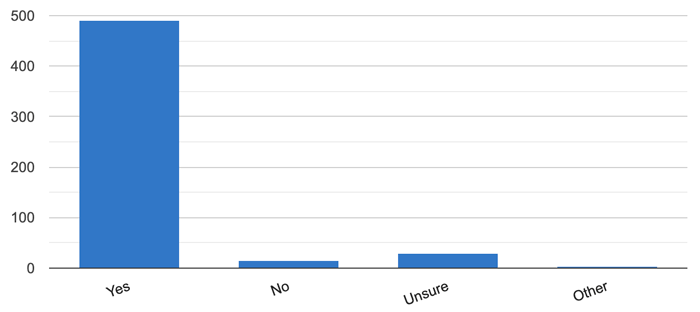
Should Public charge points have dedicated lighting
There’s a clear requirement for lighting at public chargers, with 91.6% answering Yes (up from 86.8% last year), just 2.6% saying No and 5.4% Unsure.
- Yes – 91.6%
- Unsure – 5.4%
- No – 2.6%
- Other – 0.4%
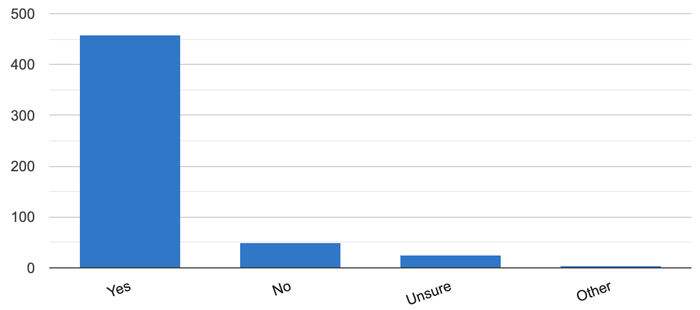
Do you find apps useful to see if a charge point is working / available?
More than 8 out of 10 people (85.6%) believe apps are useful when checking if a charge point is available. 9.2% said No while 4.7% were Unsure.
- Yes – 85.6%
- No – 9.2%
- Unsure – 4.7%
- Other – 0.5%
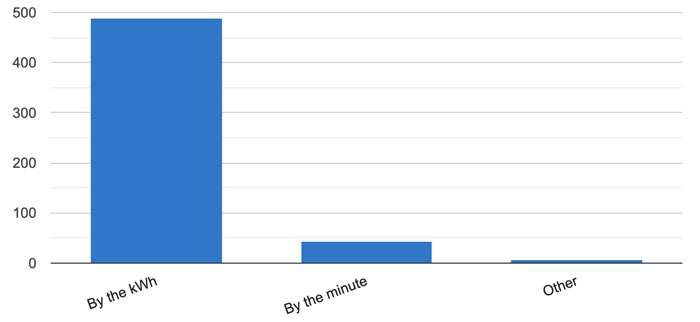
Would you prefer to pay…
More than 9 out of 10 (91.0%) want to see billing By the kWh rather than By the minute (7.9%).
- By the kWh – 91.0%
- By the minute – 7.9%
- Other – 1.1%
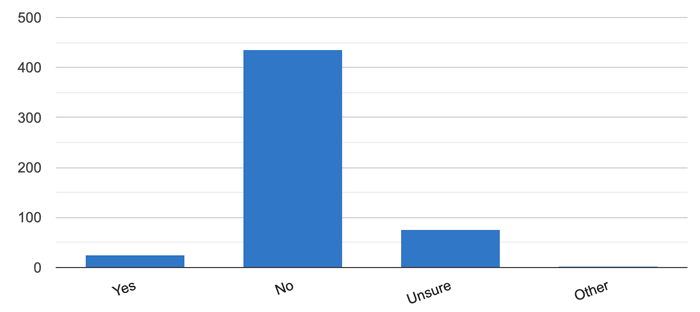
Should charge point operators add a connect fee?
81.3% are opposed to connection fees (a significant increase from 63.6% last year), while those in favour dropped from 15.0% to 4.5%.
- No – 81.3%
- Unsure – 14.0%
- Yes – 4.5%
- Other – 0.2 %
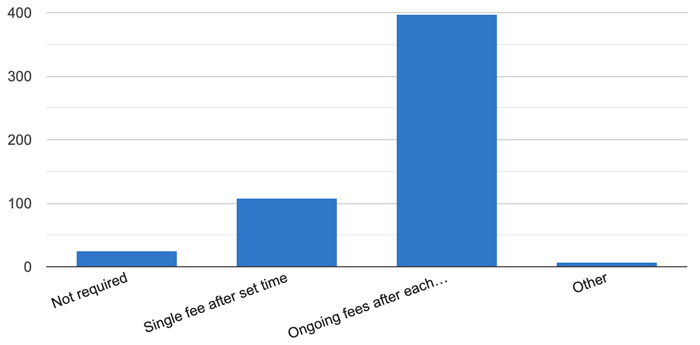
Should public charging overstay fees be…
94.4% agree that overstay fees are required with the most popular answer (74.2%) supporting the more punitive option of Ongoing fees after each set period elapses. Just 4.5% believe that overstay fees are not required.
- Ongoing fees after each set period elapses – 74.2%
- Single fee after set time – 20.2%
- Not required 4.5%
- Other – 1.1%
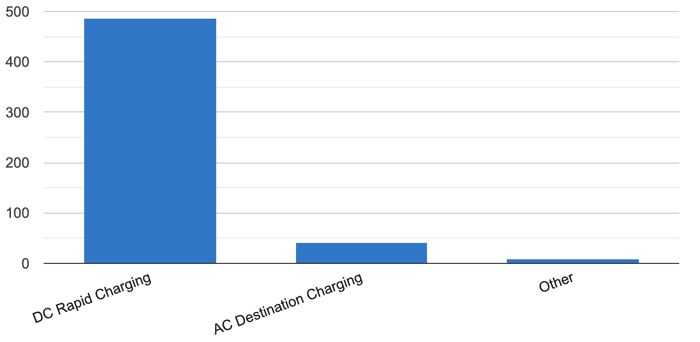
Which type of charging would you like to see prioritised going forward
9 out of 10 (90.8%) would prefer to see DC Rapid charger expansion over anything else while 7.7% would prefer to see AC charging prioritised instead.
- DC Rapid Charging – 90.8%
- AC Destination Charging – 7.7%
- Other – 1.5%
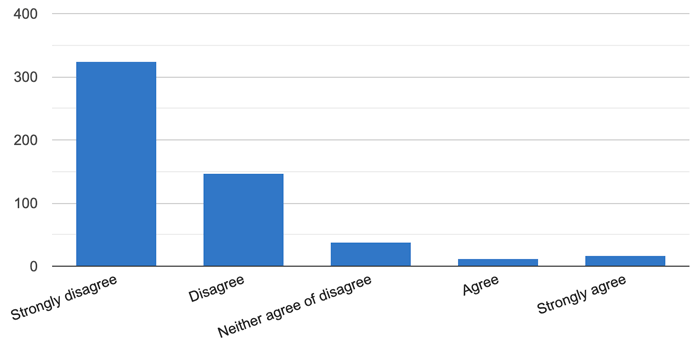
Do you agree with the statement “Northern Ireland’s Public charging network is fit for purpose”
The most popular answer here was Strongly Disagree (60.4%), a fall from 82.8% last year. That increases to a total of 87.7% when we include the Disagree answer (94.6% last year)
- Strongly disagree – 60.4%
- Disagree – 27.3%
- Neither agree of disagree – 7.1%
- Strongly agree – 3.2%
- Agree – 2.0%
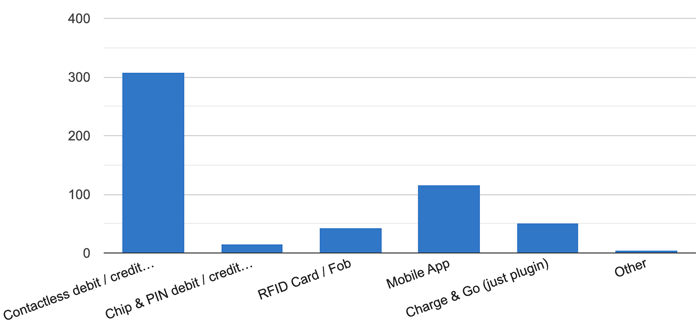
What is your preferred method of paying for public charging
The Contactless debit / credit card payment option remains the most popular (57.4%) followed by Mobile App (21.5%) and Charge & Go (9.5%).
- Contactless debit / credit card – 57.4%
- Mobile App – 21.5%
- Charge & Go (just plugin) – 9.5%
- RFID Card / Fob – 8.0%
- Chip & PIN debit / credit card – 2.8%
- Other 0.8%
Can you suggest a specific NEW location that would be a good site for a public EV charge point
We appealed for specific site locations here but mainly got more generic suggestions. Here is a table of those results – which may be of particular interest to Charge Point Operators.
Could you give up your car and use public transport and/or use active travel instead
85.8% say they Definitely could not swap their cars for public transport and / or active travel. Just 1.6% said they could (a drop from 3.0% in 2022).
- Definitely No – 85.8%
- Not sure – 11.0%
- Definitely Yes – 1.6%
- Other – 1.6%
Here are some additional comments we received around this question…
- I could use public transport if the timetable was focused on commuters rather than schools and a home to work journey was available around normal working hours.
- Already use public transport for some journeys
- I live rurally, very poor public transport.
- The public transport is so poor, that once could not give up a car to use this instead.
- Public Transport is not fit for purpose
- thinking about sharing my EV between several households in my greater family locally and using bike/public transport when i can
- Public transport in NI is not fit for purpose outside of Belfast
- Public / Active travel is but a dream in NI. The infrastructure and fleet are simply not up to modern standards.
- There is no public transport in Fermanagh besides buses. Cars are essential and there are hardly any working chargers. We are left behind as usual.
- If the infrastructure was there I would use it. It currently is not. For example returning home from Belfast on an evening by public transport is not possible.
- public transport is too expensive. My commute is 4.3m, to walk to the bus stop is 0.6m, to walk from the bus stop to work is 1.1m. 39% of my commute would be on foot. The cost of the bus would be £0.10 per mile. More than EV charging. Cycling is best option but roads not safe.
- Older and disabled people may not have a choice so public transport must keep improving and be available for all.
- Public transporter is a non starter for me. To commute from the west to Belfast it would take easy 4 hrs. A EV with a reasonable range 220 – 250 real life is more than adequate for 99% of the daily driving around NI.
- We would use public transport but we live in a rural area with virtually no buses. Buses from Downpatrick to Belfast are few and far between in the evenings. Trains to Dublin don’t run late enough for an evening out. Lots more investment needed.
- Public transport is not good enough in my area that I could do without a car.
No responses yet