Each September the Utility Regulator publishes a paper with the previous year’s fuel-mix and CO² emissions figures for each licensed supplier. Here are some of the most compelling details
Coal Powered Car
These figures are especially interesting to EV driver who are never far from the “coal power car” jibes.
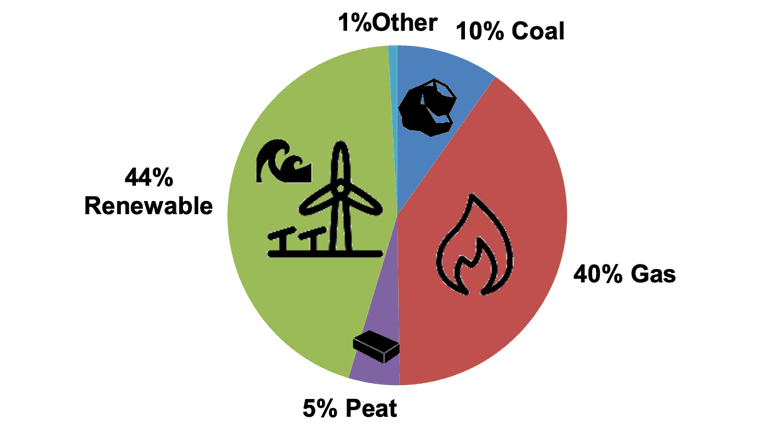
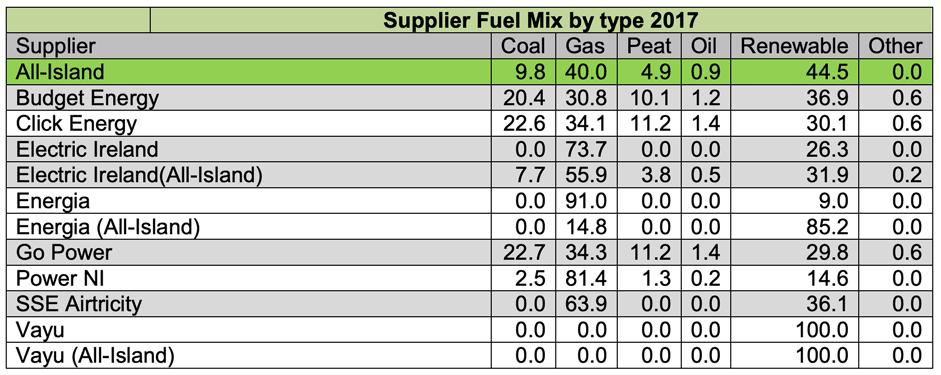
It will be surprising to many that already the largest single contributor to our supply is Renewable Energy (44.4%), even surpassing Gas (39.9%). Whilst Coal still features, a huge 28.6% drop in its use in the last 12 months has seen it fall to just 9.8% of our mix.
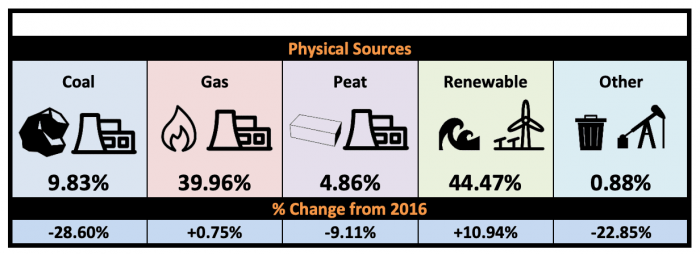
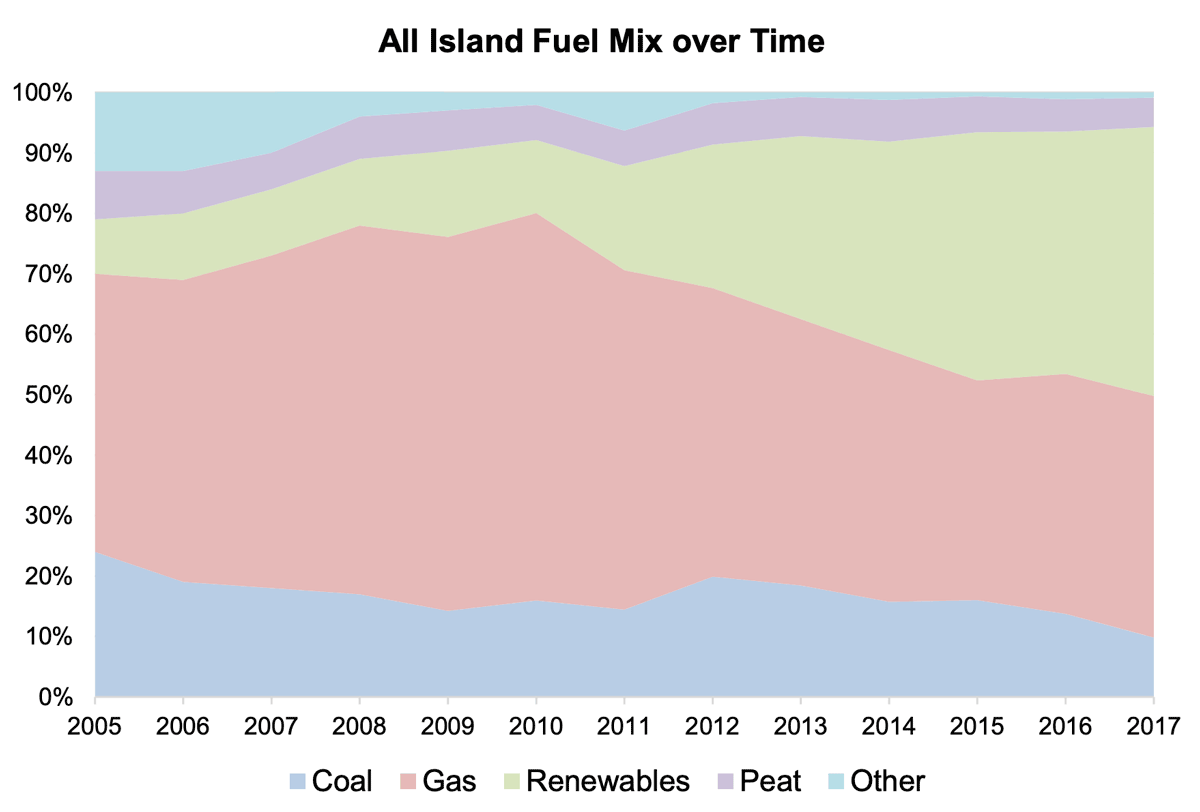
The use of fossil fuels as a fuel source has decreased from 2016 to 2017. Correspondingly the share of renewable fuel sources has increased by approximately 11% between 2016 and 2017. This has been a continuous trend over the past number of years (as outlined in the graph below).
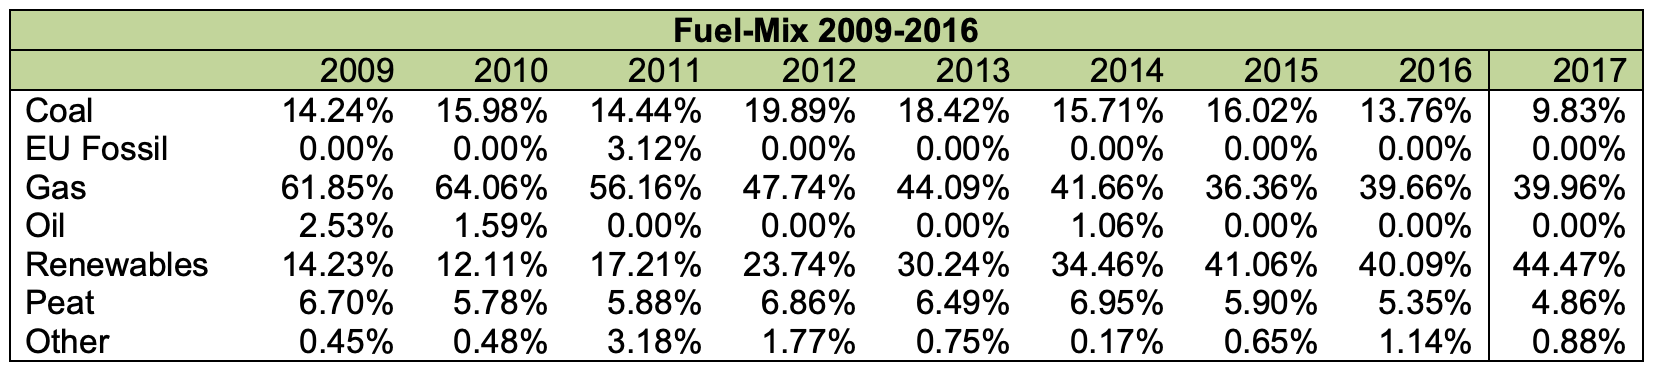
 This table gives a useful breakdown of the last 9 years, showing renewables share has more than tripled since 2009.
CO²
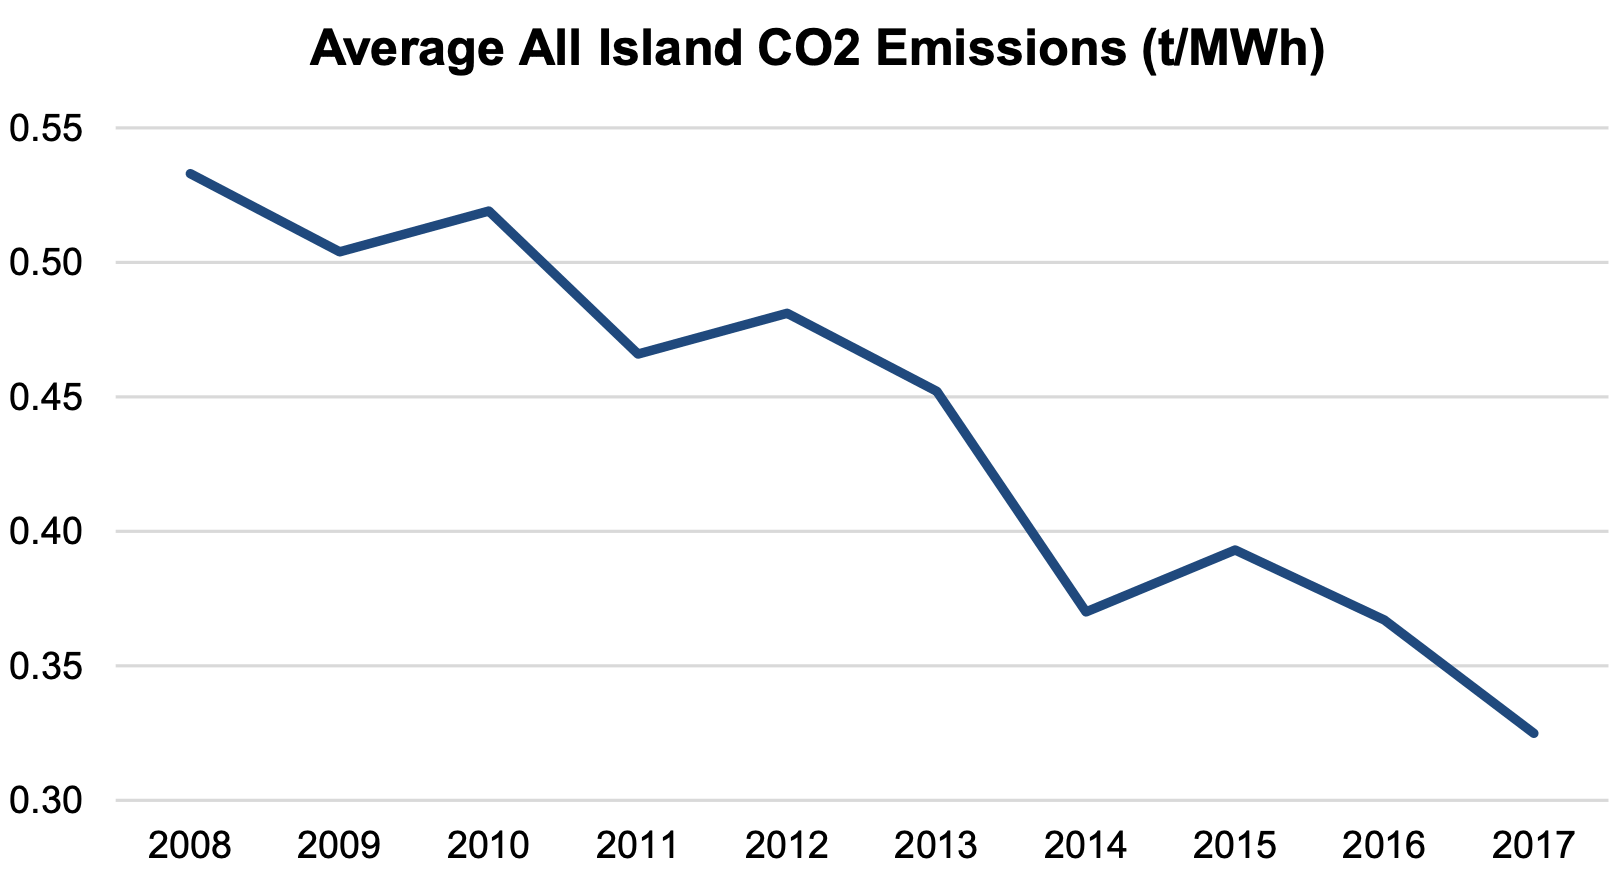
So how has this swing towards renewable and away from coal affected CO² emissions?
The average carbon dioxide emissions per MWh of electricity decreased by 13% from 0.367 t/MWh in 2016 to 0.325 t/MWh in 2017 for the island.
Suppliers
And finally to individual suppliers. There’s a huge range here with some using zero coal while others still have over 20% of the dark dirty stuff. Here is a table that may help you decide which suppliers you’d like to consider for your home and EV supply.
Check out the methodology and All-Island Residual Mix figures from the full report on the link below.
No responses yet